The session option STATISTICS IO is my friend during query tuning engagements, because it tells you exactly how many page reads you had for a specific query. Every time that SQL Server requests a page of 8KB from the Buffer Pool, it gets logged through the output of STATISTICS IO.
As a general guide I always recommend enabling STATISTICS IO to get a better understanding of how many page reads you have on the tables involved in the given query. And the goal for query tuning is to decrease these page reads as much as possible – through Indexing Strategies. The less data you read for a query, the faster your query will be. But the question for today is the following: is STATISTICS IO everything that you need for query tuning, or are there more metrics that you should be aware of?
Let’s talk about Client Statistics
Another very important option – at least from my perspective – is the Client Statistics option in SQL Server Management Studio:

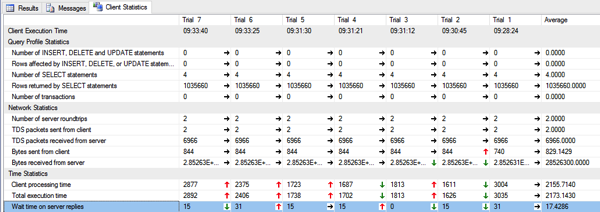
When you enable that option for your session, SQL Server Management Studio will give you more information about the client side processing of your query. The following picture shows a typical output that you get within SQL Server Management Studio:

Here SQL Server Management Studio shows you performance metrics for the last executions of your query. The most important metrics are the Network Statistics and the Time Statistics. The Network Statistics shows you the following information:
- Number of Server Roundtrips
- TDS Packets sent from Client
- TDS Packets received from Server
- Bytes sent from Client
- Bytes received from Server
Normally I concentrate here on the Bytes received from Server, because with that information to hand you can easily see how much data you are getting back from SQL Server. Of course the larger your resultset is, the more data you get back, and the longer your query will take. I have worked with queries which have returned Gigabytes of data, and people have complained that the query is slow… Well… 🙂
The Time Statistics additionally shows you the following information:
- Client Processing Time
- Total Execution Time
- Wait Time on Server Replies
The most important metric here is the Client Processing Time, because it tells you how long SQL Server Management Studio itself needed to process your query. Most of the time here is spent on consuming and visualizing the resultset within SQL Server Management Studio. Again: the larger your resultset is, the longer it takes for SQL Server Management Studio to visualize it, and therefore the query just takes longer.
Summary
STATISTICS IO is a great start for query tuning. But in addition I also use the output from the Client Statistics on a regular basis to get a better understanding of how much data is sent across the network, and how long SQL Server Management Studio itself needs to process the data.
So the next time that your query is slow, just use the Client Statistics to check how much time is spent within SQL Server Management Studio. Maybe the query itself is fast, but SQL Server Management Studio needs some time…
Thanks for your time,
-Klaus