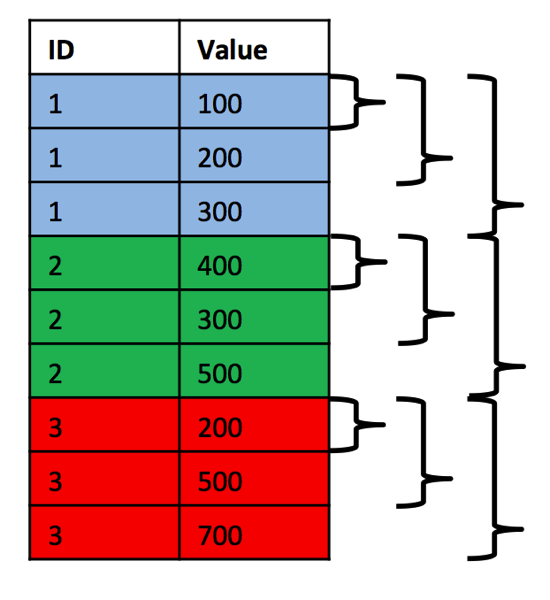
Almost every time that I present about Windowing Functions in SQL Server, people are very interested in knowing the difference between the ROWS and RANGE option when you define your window frame. Therefore I want to show you in today’s blog posting the difference between those options, and what it means to your analytic calculations.
ROWS vs. RANGE – what’s the difference?
When you open a window frame with the OVER() clause to perform your analytic calculations, you can also limit the number of rows you see in the window frame through the ROWS and RANGE option. Just look at the following T-SQL statement:
SELECT
	t.OrderYear,
	t.OrderMonth,
	t.TotalDue,
	SUM(t.TotalDue) OVER(ORDER BY t.OrderYear, t.OrderMonth ROWS BETWEEN UNBOUNDED PRECEDING AND CURRENT ROW) AS 'RunningTotal'
FROM
(
	SELECT
		YEAR(OrderDate) AS 'OrderYear',
		MONTH(OrderDate) AS 'OrderMonth',
		SalesPersonID,
		TotalDue
	FROM Sales.SalesOrderHeader
) AS t
WHERE
	t.SalesPersonID = 274
	AND t.OrderYear = 2005
GO
This T-SQL statement performs a running total calculation with the SUM() aggregate function. The window frame itself goes from the first row (UNBOUNDED PRECEDING) up to the current row (CURRENT ROW). For every row in the result set, the window frame gets larger and larger, and therefore it is very easy to perform a running total calculation. The following picture illustrates this concept.

And as you can see from the output, the result is just an ever increasing sum – the result of the running total calculation.

Imagine now what happens to your result when you change the window frame to RANGE BETWEEN UNBOUNDED PRECEDING AND CURRENT ROW:
SELECT
	t.OrderYear,
	t.OrderMonth,
	t.TotalDue,
	SUM(t.TotalDue) OVER(ORDER BY t.OrderYear, t.OrderMonth RANGE BETWEEN UNBOUNDED PRECEDING AND CURRENT ROW) AS 'RunningTotal'
FROM
(
	SELECT
		YEAR(OrderDate) AS 'OrderYear',
		MONTH(OrderDate) AS 'OrderMonth',
		SalesPersonID,
		TotalDue
	FROM Sales.SalesOrderHeader
) AS t
WHERE
	t.SalesPersonID = 274
	AND t.OrderYear = 2005
GO
As you can see now from the following picture, you get a different result, because the records for November 2005 shows the same running total sum.

Let’s try to understand why the RANGE option gives you here a different result than the ROWS option. With the ROWS option you define a fixed number of rows preceding and following the current row. Which rows you see here through your window frame depends on the ORDER BY clause of the window frame. You can also say that you define your window frame on a physical level.
Things change when you use the RANGE option. The RANGE option includes all the rows within the window frame that have the same ORDER BY values as the current row. As you can see from the previous picture, for the 2 records of November 2005 you get the same sum, because both rows have the same ORDER BY values (November 2005). With the RANGE option you define your window frame on a logical level. If more rows have the same ORDER BY value, your window frame consists of more rows than when you use the ROWS option.
Summary
In today’s blog posting you have seen the difference between the ROWS and RANGE option when you define your window frame for analytic calculations. With the ROWS option you define on a physical level how many rows are included in your window frame. With the RANGE option how many rows are included in the window frame depends on the ORDER BY values. There are also huge differences regarding the performance when you use the RANGE option. I will talk about these side-effects in a subsequent blog posting.
Thanks for your time,
-Klaus