My goal for last week was to get familiar with the HammerDB load generator and test-drive the TPC-C workload in my powerful Home Lab. This sounds like an easy task, because HammerDB automates all the necessary tasks for you. You can create the schema of the TPC-C database, and HammerDB will also populate the database with test data. And then you just run the real workload against the generated database. Unfortunately, I hit a huge performance problem that I want to describe in this blog posting, and how I resolved it.
VM Configuration
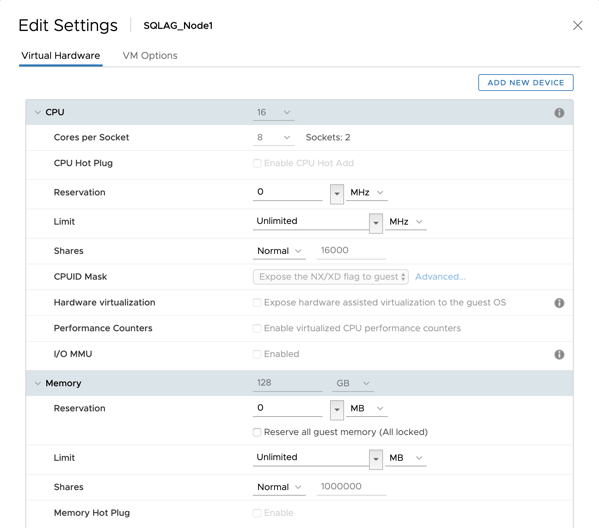
In my case, I have generated a TPC-C database with 1000 warehouses, which resulted in a database size of around 100 GB. The database was running on a standalone SQL Server 2017 instance on a VMware based virtual machine with 16 vCPUs and 128 GB RAM. The underlying ESXi Host is a 2-socket NUMA system, and therefore I have also configured vNUMA within the virtual machine accordingly.
In my case I have distributed the 16 vCPUs across 2 sockets (Cores per Socket = 8) to match the underlying NUMA topology. Therefore, ESXi created a Wide-VM where 8 vCPUs where take from each physical NUMA node. And the 128 GB RAM where also evenly distributed across both physical NUMA nodes (64 GB from each NUMA node). The following picture shows the configuration of this VM.
The Problem
Everything seems fine so far. But as soon as I was running the TPC-C workload against SQL Server, I got a strange behavior. The CPU utilization of SQL Server was somewhere between 50% – 60%, but 1 NUMA node within the virtual machine was always utilized at 100%! The following picture shows that behavior:
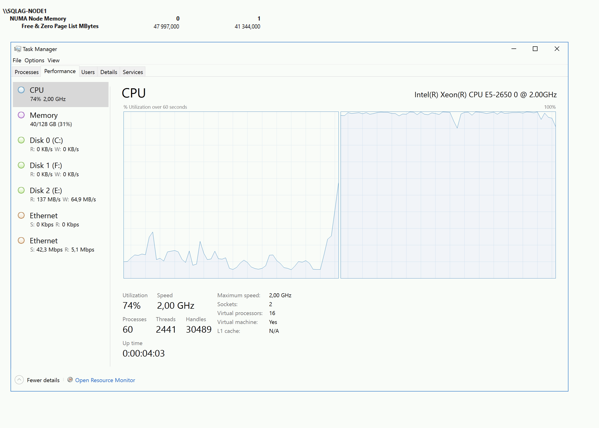
It seems that I have triggered with that workload a NUMA Node Imbalance problem, where only 1 NUMA handles the whole SQL Server workload, and the other NUMA Node is just idle. It was a default configuration of SQL Server 2017, so I haven’t made any specific settings (like Processor Affinity, taking SQLOS schedulers offline, MAXDOP, Resource Governor). When I have checked the column load_factor of sys.dm_os_schedulers I was also able to verify that SQL Server only used 1 NUMA Node for this workload:
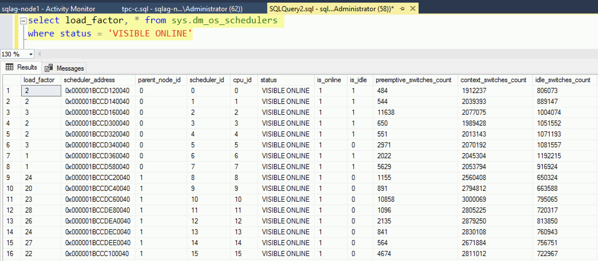
As you can see in the picture, the second NUMA node was utilized, and the first one was just idle. SQL Server implements a Round-Robin NUMA scheduler, where incoming connections are distributed in a Round-Robin fashion across the various NUMA nodes. You can also check the affinity of a connection in sys.dm_exec_connections:
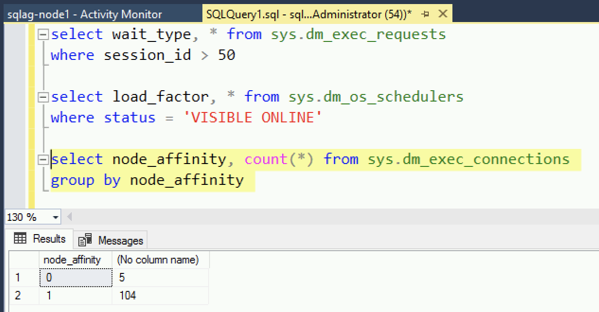
All the connections are affinitized to only 1 NUMA node. So why the heck SQL Server is doing it in that way with that specific workload? To check if the NUMA scheduler of SQL Server is working as expected, I have opened 50 different connections within SQL Server Management Studio, and guess what: SQL Server has distributed the connections as expected across the 2 NUMA nodes:
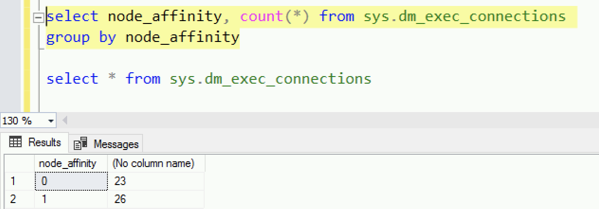
This also means that SQL Server itself has no problem, and that the problem must be the workload – as usual.
The Solution
I have spent a lot of time researching if someone else has also already had this specific problem with the TPC-C workload. Because my test-case that I was running, was not that specific. Even HammerDB states in their documentation that NUMA should work as expected with their software.
To make some progress, I have finally asked Mr. SQL Server NUMA (you also have to check-out his blog!) on Twitter, if he can help me to troubleshoot that problem. We have checked a lot of things together (SQL Server configuration again, various Performance Counters), but the result was the same again: SQL Server itself is not the problem. But then, Lonny made an interesting statement:
i suspect (but haven;t proven yet) that every persistent user connection is followed by a short-lived connection. something like a user count, etc. That would result in all persistent connections on one NUMA node, and all short-lived on the other…
— L_ N___ (@sqL_handLe) September 20, 2019
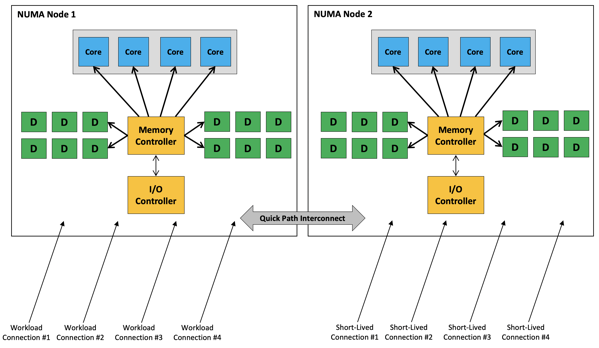
As I have said previously, SQL Server distributes the incoming connections in a Round-Robin fashion across the available NUMA nodes. Maybe HammerDB opens a connection for the workload, and then opens another short-lived connection (maybe checking if the previous opened connection was established), and then opens another connection for the next virtual user.
This would mean that all workload connections would land in one NUMA node, and all the short-lived connections would land in the other NUMA node. But they are short-live, therefore they are closed immediately, and that NUMA node would not be utilized in any way. The following pictures tries to visualize that idea:
We have then talked with HammerDB on Twitter about that observation, and their first initial response was as expected: HammerDB doesn’t cause this problem, fix your SQL Server!
Nothing in the client to distribute the workload to a particular NUMA node – this is entirely on the SQL Server side. Similar seen with multiple server processor groups. One mitigation here was reduce the User delay in the VU options so the delay between logins is lower eg 5ms.
— HammerDB (@hammerdbresult) September 20, 2019
Then we have talked a little bit in more details with them about our observations, and finally they revoked their initial statement:
Ahhhh! – there is something already fixed in the new version being worked on – line 57 shouldn't be there – so try commenting
else {#database connect odbc $connection
if {!$azure} {odbc "use $database"}
Sorry! i think this crept when adding azure options— HammerDB (@hammerdbresult) September 20, 2019
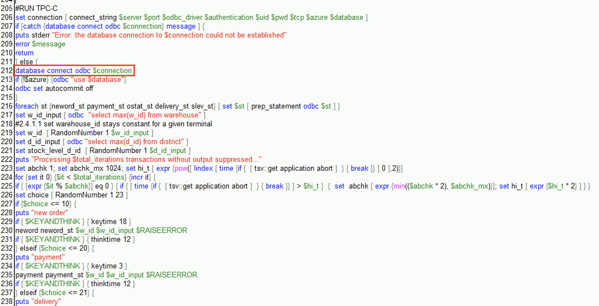
Now we had the verification: it’s the workload, NOT SQL Server! In line 212 of the generated HammerDB script they are opening an additional – not needed – connection to SQL Server, which is afterwards immediately closed:
As soon as I have removed that line, and ran the workload again, I had an evenly distributed TPC-C workload across my 2 NUMA nodes:
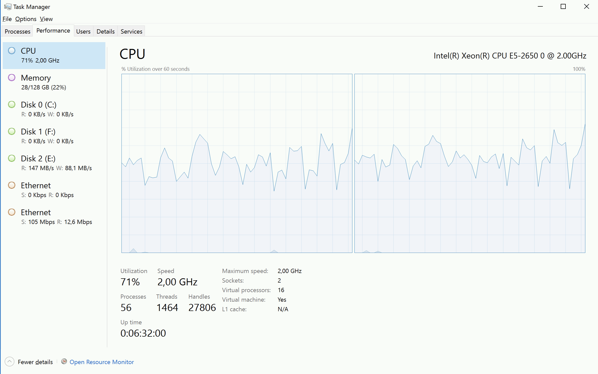

There are no short-lived connections anymore, and therefore the workload connections are now evenly distributed across the 2 NUMA nodes. Houston, we have solved the problem!
Summary
I have already heard a few times about NUMA Node Imbalance problems, but I have never ever seen them with my own eyes. Therefore, I was quite happy when I have observed that problem, but it drove me crazy not to know the underlying root cause why this problem occurs.
So, please keep this information in your mind if you have a NUMA system for your SQL Server workload. If your workload includes some short-lived connections it can happen quite fast that you have a NUMA Node Imbalance problem. Identifying the problem is quite easy, but troubleshooting it is another thing. You have also seen that SQL Server doesn’t really care about the load factor of a given NUMA node. SQL Server just distributes the incoming connections in a round robin fashion. We can also discuss if this is a good or bad approach…
I also want to thank Lonny to help me to resolve that problem (and to understand it), and also HammerDB for their fast response and help on Twitter.
Thanks for your time,
-Klaus
5 thoughts on “Troubleshooting NUMA Node Imbalance Problems”
Good catch, Klaus!
Never ever let NUMA imbalance occur. For example, assigning 10 vCPUs on two sockets on two 8-core CPUs using core affinity in vCenter/ESXi level. Or set SQL Server processor affinity to utilize 2 cores from one node and let’s say 4 cores from the other.
Since SQL Server assigns the workload evenly in a round-robin manner, you will overload the cores of the smaller (logical) node leading to OS processor queueing – that you don’t want to see.
Hi that’s very interesting observation. Thanks for sharing. Another great example open source world is so…fantastic!
Hi Klaus,
I run in the same issue last year but with SAP on a large (2×10) core virtual machine. I partially reproduced the issue with hammerDB and I ended up disabling NUMA on SQL Server which increased performance. Please note that Oracle suggests to disable NUMA too in equivalent scenarios. But your post make me think… What could I do with SAP?
I have caught this twice at clients, who’s stupid apps did the same thing.
I don’t mean to take ANYTHING away from Mr. L/N, whom I have a TREMENDOUS amount of respect for and always love catching up with (which has been too long BTW!), or from the dogged work you (whom I ALSO have a TREMENDOUS amount of respect for!) put into discerning the cause here. But this problem could have been debugged in about 5 minutes with a simple Profiler trace. With that you would have seen the intermixed “extraneous” calls and been able to easy identify that they were “pinning” to the low-use NUMA-node schedulers. Give that info to the HammerDB people, and they then don’t have to look like uninformed “SQL Server haters”, but would instead have a simple and 100% accurate way to find the code at fault. They quickly build a box around it and issue a patch to the world.
BTW, Profiler has been deprecated for MANY versions of SQL Server now. But I still use it EVERY DAY, and can PROMISE you that I will still be using it in 2038 should I still be alive and consulting on SQL Server. I can say this will completed certainty because I still have clients with SQL 2000 in production, so I will undoubtedly have clients with SQL 2019 (or even earlier) in production 19 years from now. 🙂
Best,
@TheSQLGuru
Thank you Klaus,
Again perfect trouble shooting and problem solving.
Best regards,
Nico John